
Workforce Cost and Productivity Diagnostic
A workforce cost and productivity diagnostic shows what your people really cost and what they produce, plant by plant. HRBS compares permanent, contract and apprentice cost, attrition, overtime and absence with output, then ranks the three changes that would help most.
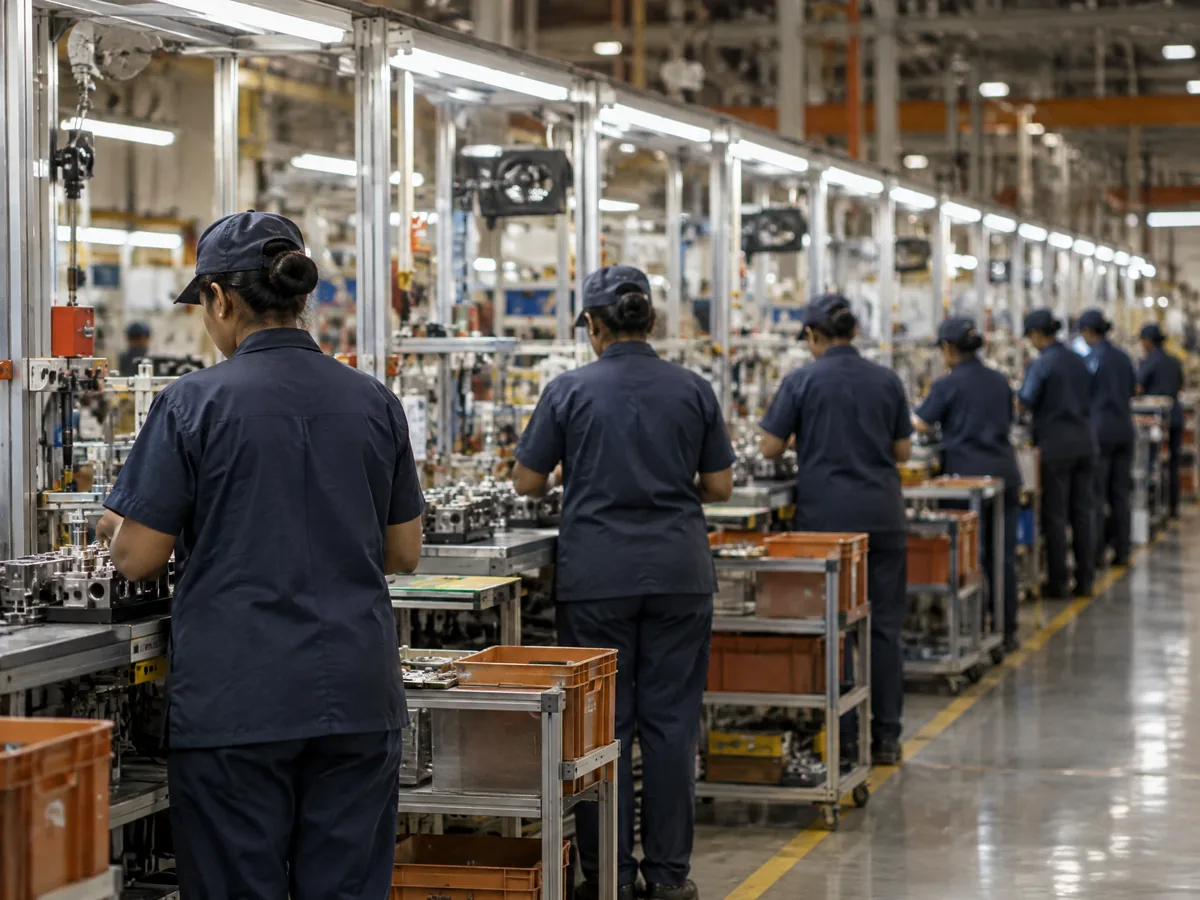
What Workforce Cost and Productivity Diagnostic includes
Six areas, each with a clear output.
The scope on one page
Signs you need this
If several of these sound familiar, this service is worth a conversation.
- Labour cost rises faster than output and nobody can say why.
- Overtime has become a normal part of every month.
- Contractor invoices grow but headcount looks flat.
- New joiners leave within the first few months.
- One plant needs far more people than another for similar work.
- You are deciding on apprenticeship without the numbers.
Questions to ask any provider
Use these to judge HRBS or anyone else. A good provider answers each one plainly before work starts.
- Which costs will you include in cost per head, and which will you leave out?
- How will you compare plants with different products or shifts?
- Will the findings be ranked, or just listed?
- What data will you need from us, and in what form?
- How will we track the measures after the review ends?
Common mistakes in measuring workforce cost
Four patterns we see often. Each is cheap to avoid and costly to fix later.

Who it suits
It suits manufacturers with one or more plants who feel labour cost rising without knowing why, who rely on contract labour, or who are deciding whether apprenticeship would lower cost. It also suits HR heads who need numbers to argue for a change to hiring or shift planning.
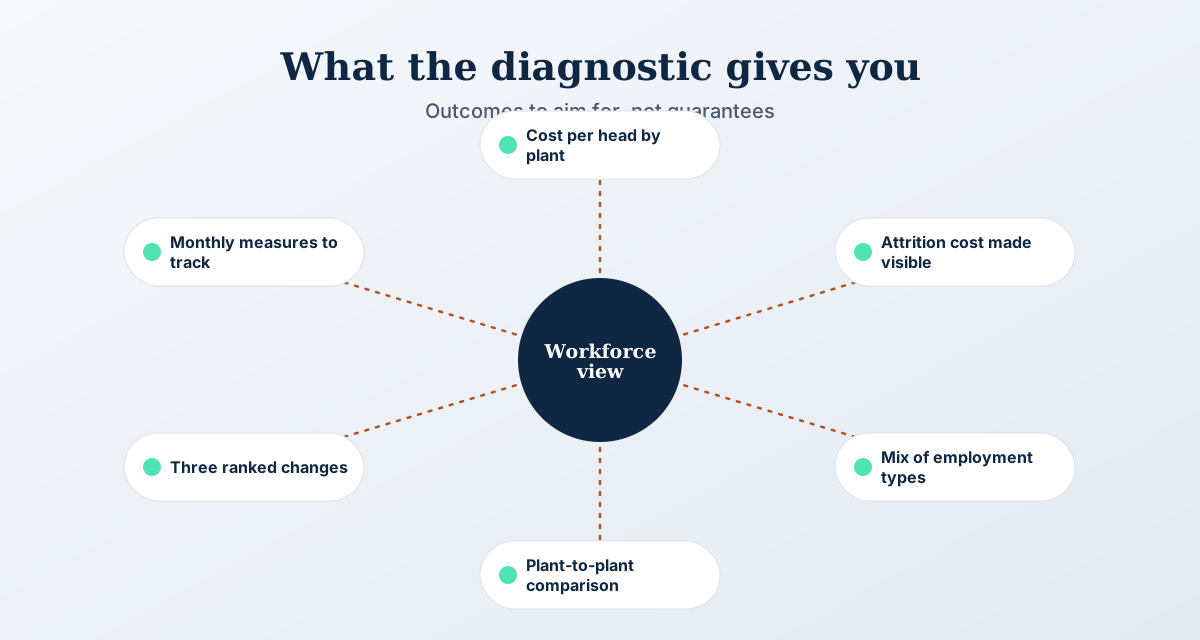
What you receive
- A cost per head table by plant, role group and employment type
- An attrition and vacancy cost view with the roles that lose most people
- A comparison of permanent, contract and apprentice routes for chosen roles
- Three ranked changes, each with the data behind it and the effort required
- A short list of the measures to track monthly after the review
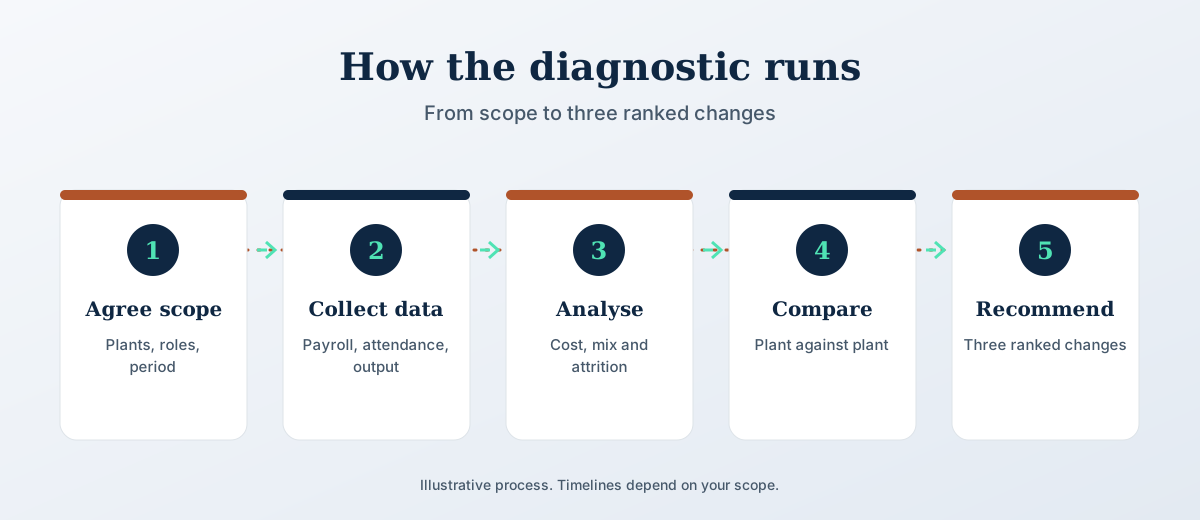
How Workforce Cost and Productivity Diagnostic works
Five steps. The scope and timeline are agreed in writing before work starts.
The process in pictures
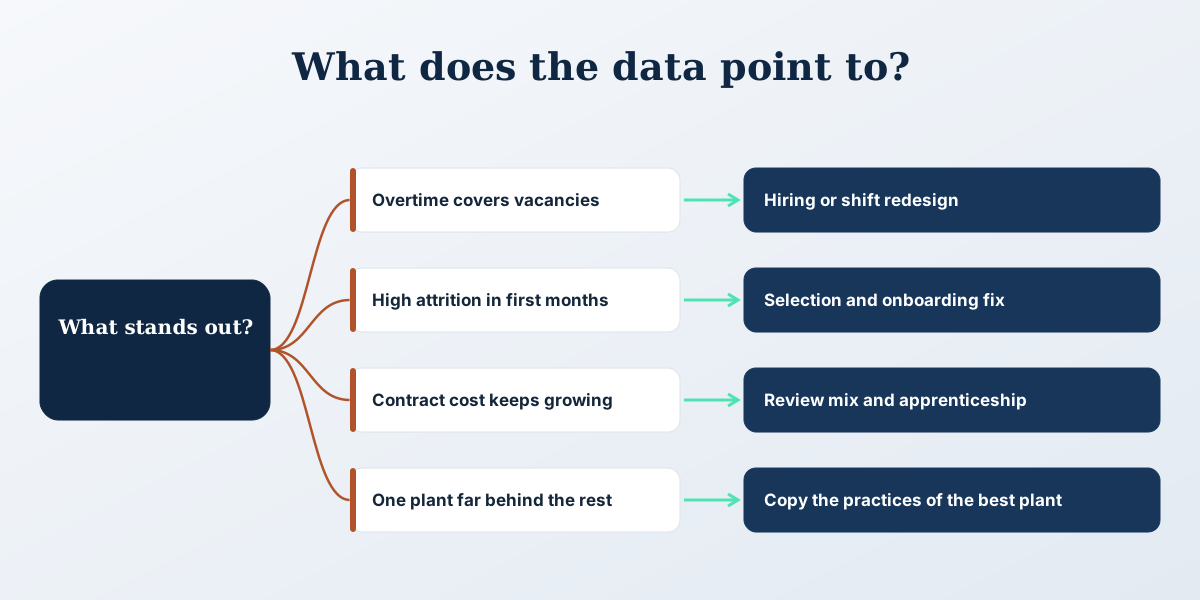
Three views of how this works: the steps, how to choose, and what to aim for.
Why it matters
Most plants know their payroll total and little else. Cost per head hides inside several budgets: wages in one, contractor invoices in another, training in a third. Without a single view, decisions follow habit. A manager adds overtime because it is quick, even when a trained apprentice would cost less within a year. A diagnostic puts the pieces side by side. It also shows where attrition drains output, which is often the largest hidden cost, and where it is a symptom of shift design or supervision.
What we need from you
- Payroll and contractor invoices for the period
- Attendance, overtime and shift records
- Output or production figures by shift or line
- Attrition and joining lists with dates and reasons
Not included
- Changes to contracts or terminations, which stay with you
- Legal opinions on contractor or apprentice arrangements
- A promise of a specific saving
Workforce Cost and Productivity Diagnostic FAQs
What is a workforce cost diagnostic?
It is a review that puts all labour costs for a plant in one view, compares employment types, and links cost to output. It ends in a short list of ranked changes rather than a long report.
What data do you need from us?
Payroll, contractor invoices, attendance and overtime, output figures and attrition lists for an agreed period. Most plants hold these already, in different places.
Will it tell us whether to use apprentices?
It compares permanent, contract and apprentice cost for chosen roles with your own numbers. The answer depends on trade, stipend, training load and scheme rules, which change, so check the current position.
Can it cover several plants?
Yes. Comparing plants is one of its main uses. Differences in cost, attrition and output between sites often point to practices worth copying or fixing.
Do you promise savings?
No. The diagnostic shows where cost and output differ and what to change first. Savings depend on whether and how you act on the findings.
How long does it take?
It depends on the number of plants and how ready the data is. The scope and timeline are agreed in writing after a short call.
What is workforce productivity?
Workforce productivity is the output your people produce for the hours and cost they take. In a plant it is usually measured as output per man-hour or per shift, set against the full cost of the workforce on that line.
Do we need an HRMS for a workforce productivity diagnostic?
No. Spreadsheets of payroll, attendance and output are enough. A system makes the data faster to collect, but the analysis does not depend on one.
Can the diagnostic cover contract workers?
Yes. Contract workers are often a large part of the workforce, so HRBS includes their cost, attendance and attrition, using contractor records and your gate records.
What goes into a true cost per head
Most plants quote one figure. The real number is a stack of smaller ones, and each sits in a different budget.
Reading the numbers: what each pattern usually points to
A diagnostic does not decide for you. It shows a pattern and the question to ask next. These are the readings we test against your data before suggesting any change.
- High overtime on one shift only: usually a staffing gap or a skills gap on that shift, not a plant-wide shortage.
- Exits clustered in the first three months: look at hiring fit, induction and the first supervisor, before looking at pay.
- Contractor headcount flat, invoices rising: check rates, hours billed and what the contractor now supplies that it did not before.
- Same product, different headcount across plants: compare shift length, line layout and absence before assuming one plant is overstaffed.
Permanent, contract or apprentice: how to compare fairly
Compare by role, not by category. A welder, a packer and a machine setter each need different training time and carry different risk if they leave.
- Use the same period and the same shift pattern for every route.
- Include training time and output lost while learning, not only the stipend or wage.
- Show the break-even point: how many months before the cheaper-looking route stops being cheaper.
- Keep legal questions on contractor or apprentice arrangements with your counsel. HRBS supplies the numbers, not a legal opinion.
Before you book: a short data checklist
You do not need clean data. You need data that covers the same period. Gather these and the first call becomes far more useful.
- Three to six months of payroll by plant and role group
- Contractor invoices matched to the headcount they covered
- Overtime hours by shift, from attendance or gate records
- Output by line or shift in whatever unit the plant already tracks
- Joining and leaving lists with dates and the reason recorded at exit
Who should be in the room
The findings cross budgets, so the people who own those budgets should see them together.
- Plant head, who owns output and shift planning
- HR head, who owns hiring, attrition and records
- Finance or accounts, who hold contractor invoices and payroll totals
- One line supervisor, who knows why the numbers look the way they do
This service is a poor fit if you want a headcount cut list. The review ranks changes by cost and effort. What to do with people stays your decision.
Common questions
How is cost per head different from payroll cost?
Payroll is wages and statutory costs for your own employees. Cost per head adds contractor margins, overtime premiums, training, supervision time and the cost of vacant roles, then divides by the people actually working. It is a higher and more honest figure, and it lets you compare permanent, contract and apprentice routes fairly.
Which plants should we start with if we have several?
Start with the two plants that look most different, such as the highest and lowest cost per unit, or the highest and lowest attrition. The gap between them shows what is worth copying or fixing. A third plant can be added once the method is working and the data format is agreed.
Can the diagnostic show whether overtime is a staffing problem?
Yes, in most cases. We split overtime by shift, line and week, and set it against absence and vacancies. If it sits on one shift or one skill, it points to a gap there. If it is spread everywhere, planning or demand swings are more likely. The data suggests the cause, and your team confirms it.
Talk to HRBS about Workforce Cost and Productivity Diagnostic
Book a free HR review. It is a short call, and we tell you what to do first.
Book an HR review